
Goal Trend, abbreviated GT, is ScoreTrend's proprietary numerical indicator that anticipates' the possible arrival of a goal with advanced statistical precision. While the match histogram chart provides an indication of how a team is actually playing in real time, the GT chart highlights the probability of a goal, regardless of which team might score it.
Goal Trend and bar chart are complementary tools as they provide different but integrated information for a complete evaluation of game dynamics.
Where is the Goal Trend?
The Goal Trend graph represents a high-value feature and is available in ScoreTrend subscriptions starting with the Premium plan. The Goal Trend is an essential tool for predicting the likelihood of a goal with high statistical significance. The GT is integrated under ScoreTrend bar graphs and in all key services such as Automated Alerts and Live Scanner.
Goal trend Graphic
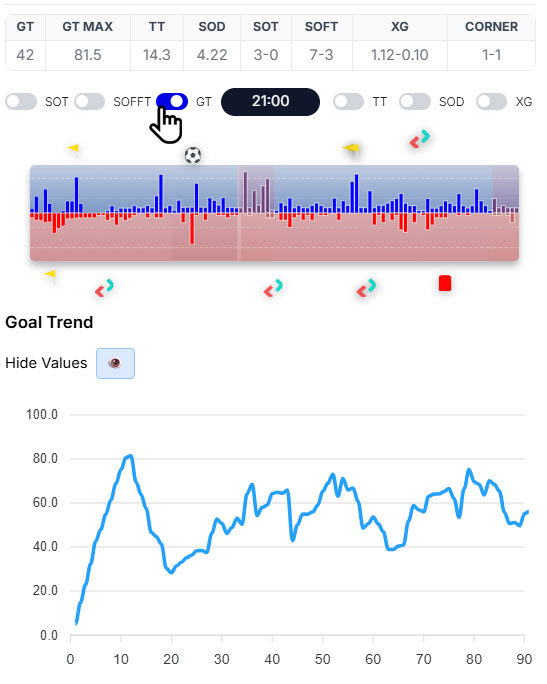
To enable the GT chart display, you need to activate the slider in the "Enable GT" section. The chart will automatically be integrated under the main bar chart. This indicator is available for both desktop and mobile apps, ensuring full functionality on any device.
GT Numerical Value
The GT numerical value is the key element for identifying matches with a high probability of goals. The GT can be viewed in the Live Events section of ScoreTrend and in the dedicated Live Scanner. In the Scanner, you can configure colored visual alerts when strategic thresholds for trading are reached. GT values range from 0 to a maximum of 200.
How to Use the GT Graph
The GT graph is represented by a continuous line that displays values based on the timing of the match. The vertical axis (ordinate) shows the indicator's numerical values, while the horizontal axis (abscissa) represents the game time.
The Goal Trend value is always positive and indicates the statistically calculated probability that one of the two teams will score a goal. GT does not provide indications on which specific team will score, but quantifies the general probability of a goal. When the indicator reaches high values, a goal can occur even several minutes later, when the match apparently seems to have "normalized". The faster the graph curve grows, the higher the probability of an imminent goal. GT values above 120 lead to a statistically very high probability of a goal being scored.
Interpretation of Numerical Values
The numerical values of the Goal Trend can be interpreted according to the following range:
- • 0-50: Limited intensity with few significant scoring opportunities. In this phase, a goal could result from sporadic play, defensive/goalkeeping errors, or rapid verticalization. This phase is ideal for under-the-barrel strategies or maintaining pre-match positions.
- • 50-80: Higher intensity with several moves and potential scoring opportunities. Structured attacks by both teams, frequent corners. The match becomes competitive and fast-paced.
- • 80-100: High intensity with numerous shots on target, off-target attempts, corners, and decisive saves by the goalkeeper. This phase is ideal for over-the-barrel strategies, using Dynamic Line Stats to determine the optimal time to enter the game.
- • 100: Very high intensity, continuous attacks, and likely counterattacks. A phase characterized by dangerous play, goalkeeper saves, and potential imminent goals. A GT > 100 combined with a SOD > 5 leads to a goal with a very high statistical probability.
Chart Patterns
To predict a "potential" goal more accurately, it's useful to identify recurring chart patterns. In professional sports trading, it's essential to wait for an entry opportunity with the optimal risk/reward ratio. It's recommended to wait for opportunities characterized by high GT values and statistically recurring chart patterns.
Main configurations for entry into over-the-counter markets:
- • Break of the previous high: The chart, after a downward phase, surpasses the previously established high, reaching values above 100;
- • Break of a double top: After forming two approximately equivalent highs above 80, the chart drops and then rises, breaking the previous high;
- • Spike after 20-30 minutes: After 20 minutes of trading, the curve records an upward trend, with a high above 110;
- • Break of a bearish trend line: The chart forms lower highs, forming a bearish trend line. This trend line is violated, with the curve moving upward, forming a new high above 90-100.
These patterns represent technical signals with a high probability of a goal.