
How ScoreTrend® Works
A Complete Solution
ScoreTrend is the most complete and advanced tool with features to make profits in betting and sports trading. Each tool is designed to function autonomously, while maintaining strategic correlations with the other modules of the platform. A complete solution that eliminates the need to use multiple platforms.
Autonomous Tools
Each module functions independently while maintaining strategic correlations with the others.
All-in-One
Eliminates the need to use multiple platforms with an integrated solution.
What is ScoreTrend and how it works
Web and Mobile Platform
ScoreTrend is a web and mobile platform that integrates all the necessary tools for professional sports trading and betting. In ScoreTrend, everything needed to operate successfully is present, developed according to professional standards with meticulous attention to detail and operational functionalities.
ScoreTrend was born as specialized software for live with exclusive bar charts (they perfectly follow the progress of the match) and subsequently expanded with prematch modules, odds, statistics, etc.
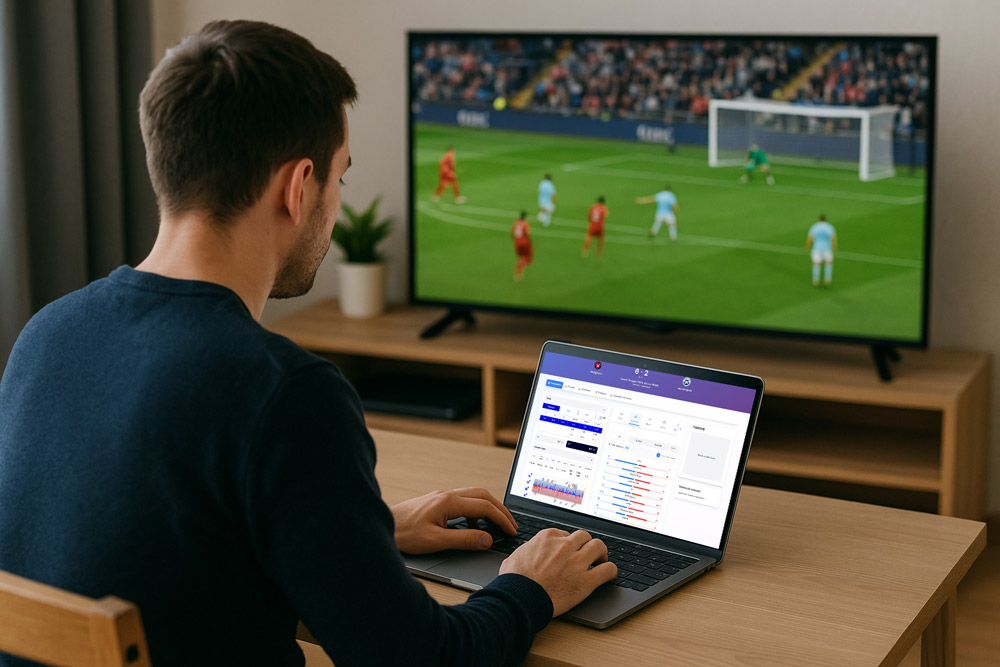
Exclusive Charts
Users who have used our charts and watched the match on TV are impressed by the realism and precision of the representations. The bar charts use a proprietary and unique algorithm and cannot be compared with other services. ScoreTrend integrates numerous tools that provide diverse and complementary information to reduce operational risk and amplify profit probabilities in sports trading.
All Tools
The main ScoreTrend tools are analyzed below. For a comprehensive understanding of their operation and optimal use, it is recommended to consult the technical articles on our blog and the video tutorials available on YouTube.
ScoreTrend Home Page
The system's operational center
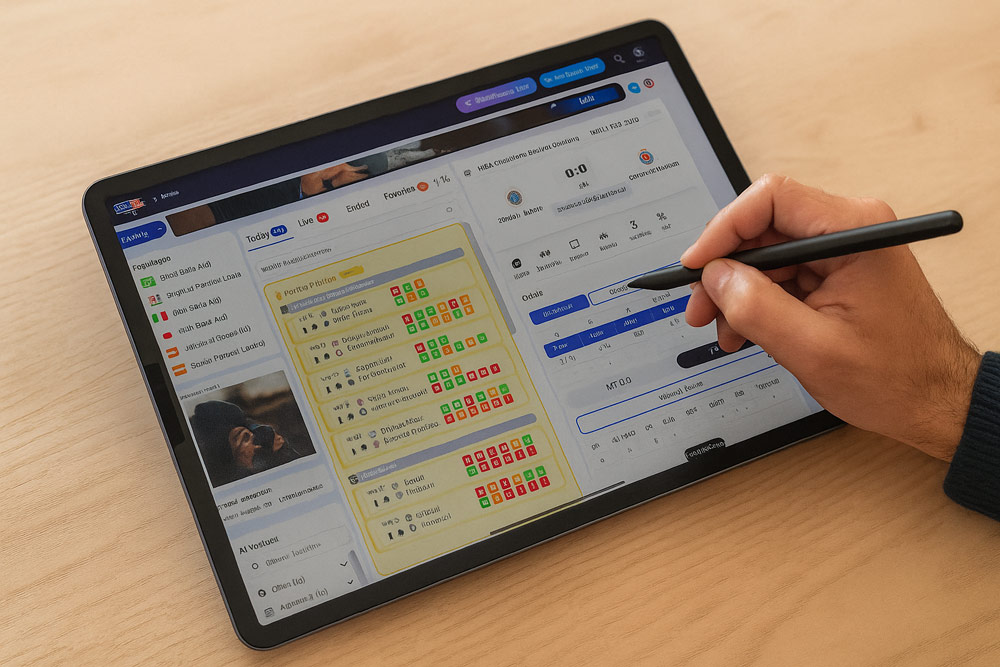
Operational Center
The system's operational center is the home page, where all world leagues and live matches are present in real time. In the top navigation bar, you will find direct links to all our professional tools.
In the left sidebar, nations and their respective leagues are organized, with the number of scheduled matches for each competition indicated in parentheses.
Match Organization
Today
Complete daily calendar
Live
Matches in progress in real time
Finished
Results and post-analysis
Favorites
User's personalized selection
Bar Charts
The pulsating heart of ScoreTrend
Field Dynamics
The bar charts describe the field dynamics through histograms updated every 30 seconds. The blue bars at the top represent the home team, while the red ones represent the away team.
The height of the bars correlated with the proximity to the upper margin indicates the intensity of offensive pressure and the probability of scoring a goal. Bars of limited height indicate scarce team movement and a lower probability of imminent events.
Proprietary Algorithm
The bar calibration algorithm is proprietary and considers a complex series of real-time live data and statistics. Not comparable with competitor solutions.
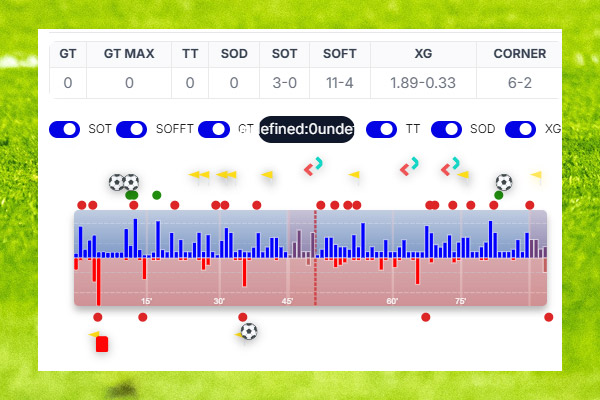
Events Displayed
Shots on Goal
Shots Off Target
Corners
Goals
Substitutions
Proprietary Indicators
The real advantage of the software for predicting goals
The proprietary indicators are one of the software's advantages and allow you to "predict" the arrival of a goal in advance with high statistical probability.
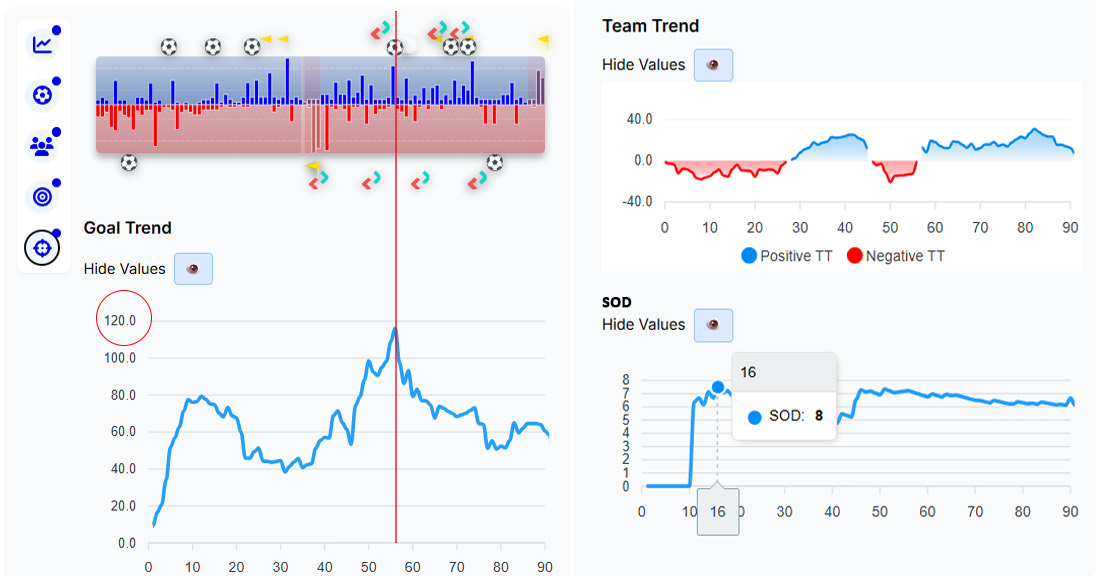
Goal Trend (GT)
The GT numerically expresses the intensity of play of both teams, calculating the probability of a goal being scored. The GT provides an instantaneous value (based on the last 10 minutes approximately) indicating what is happening at that specific moment.
Values > 100: The match is becoming "explosive" with an imminent goal. The faster the GT growth rate, the higher the probability of scoring.
Interpretive Value Ranges
Limited intensity
Few goal opportunities. Optimal for scalping or under strategies
Moderate intensity
Multiple opportunities. The match is starting to become competitive
High intensity
Numerous goal opportunities. Combine with SOD > 4.00
Very high intensity
Goal is imminent. Possible to enter on current over
TT Value Interpretation
Limited predominance of the home team, alternated by the away team's possession
Dominance of the home team with shots on goal and consistent attacks
Almost exclusive dominance with siege on the opponent's goal
Team Trend (TT)
The Team Trend identifies which team is "leading" the game more, is attacking more, and has greater ball possession. High values highlight a team's control of the game.
Positive values (+): Home team
Negative values (-): Away team
SOD (Reliability)
SOD was developed as a "certification" indicator for the reliability of a goal alert. In the current version, you will find the reliability graph starting from the 10th minute (to avoid changing the value scale). It considers the entire match history: consequently, high GT and SOD values lead to a goal with a high probability.
For over operations: Entry with SOD values greater than 3.5 is recommended
SOD has variable reference values relative to match timing:
XGoal
For major matches where Expected Goal (XG) is calculated, the minute-by-minute graph of this indicator is available. XGoal measures the probability that a shot will turn into a goal.
XTrend
XTrend is the new proprietary indicator derived from Expected Goals. It is not present in all matches but only in major leagues.
Values > 1.5 indicate a good probability of a goal but must be used exclusively in conjunction with GT and SOD in the Multichart.
Multi Chart
Unique tool that integrates multiple charts
Indicator Convergence
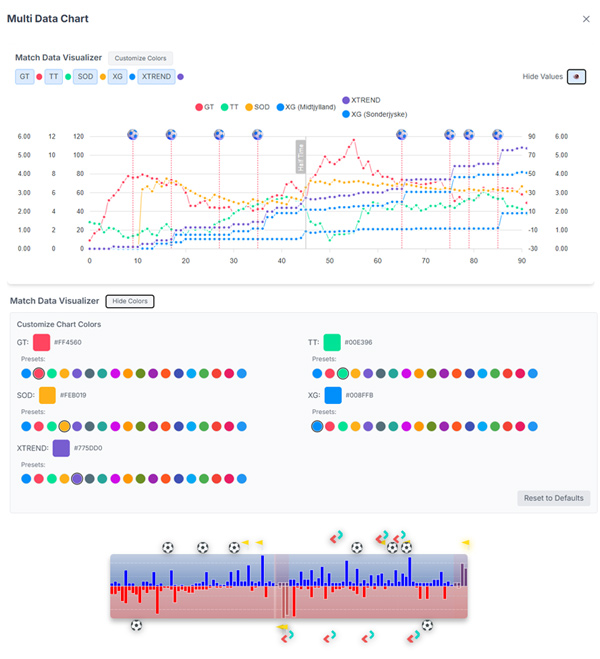
The Multichart is a unique tool that integrates multiple charts into a single panel. The Multichart window includes GT, TT, SOD, XGoal, and XTrend charts.
Strong Signal
When the charts converge upwards with:
- GT > 100
- SOD > 5
- XTrend > 1
the goal has a very high probability of being scored. The Multichart is an additional tool with high added value, available as a separate window or fixed on the right desktop in chart mode.
The Multichart can be purchased separately and is not included in subscription plans.
Other Professional Tools
A complete suite for every need
Statistical Graphs
Numerous statistical graphs viewable under the main graph with shots, possession, corners, and operational metrics.
Odds Panel
Tool to understand the potential course of the match through bookmaker odds movements.
Events & Lineups
Match events, official lineups when available, and detailed home/away standings.
Live Statistics
Integrated live statistics for first half, second half, totals, and customizable intervals.
Match Alert
Specific alerts for single matches configurable for goals, results, and proprietary indicators.
Dynamic Line Stats
The best live and pre-match statistical analysis tool to identify optimal timings.
Expand Event
Complete match sheet with all functionalities and statistics in extended format.
Live Dashboard Alert
The added value of our system with an unparalleled success rate
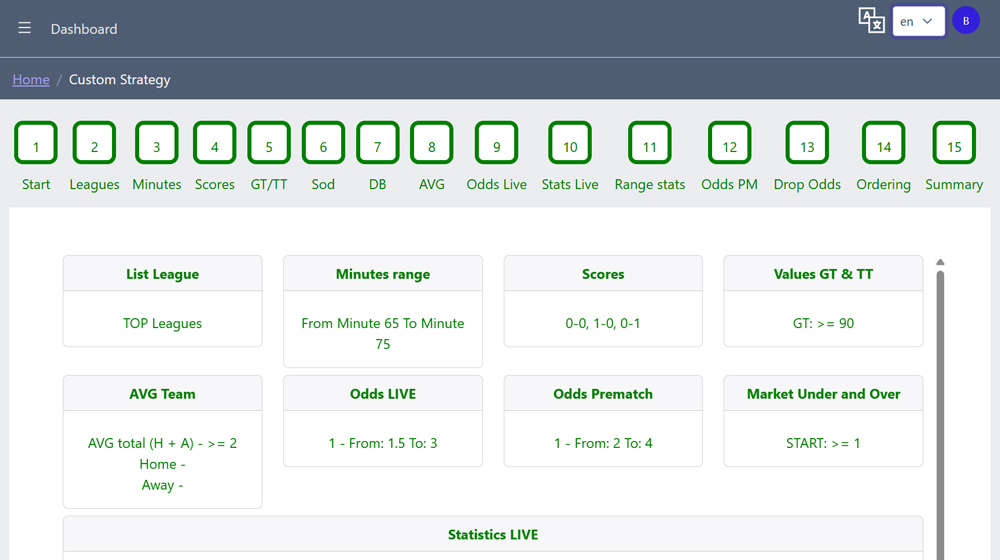
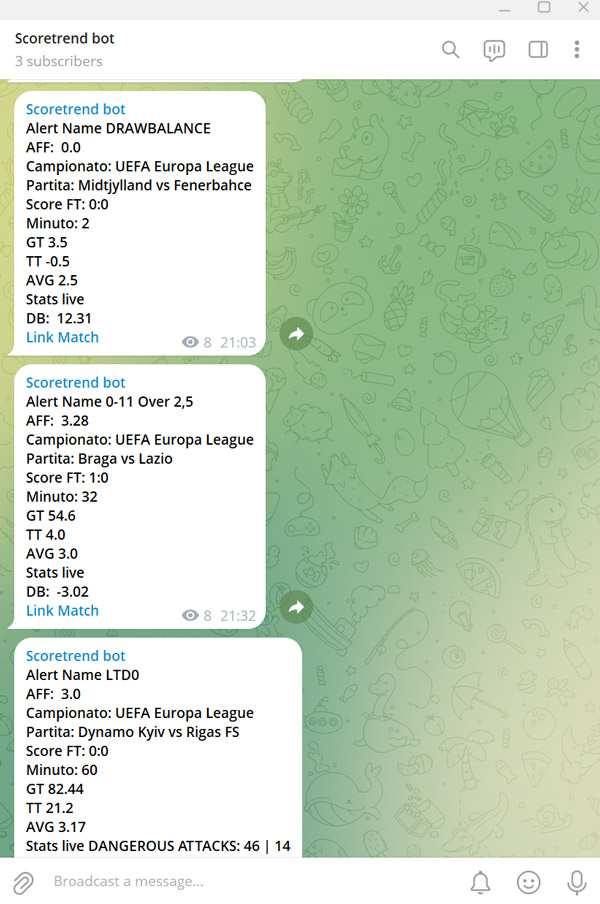
ScoreTrend's live alerts represent one of the plus points of our system. The live Alert console is the most complete available on the market, with proprietary indicators for an "unparalleled" success rate.
Goal Trend
Proprietary indicator to predict goals
Team Trend
Identifies which team is leading the game
SOD Reliability
Alert reliability certification
Draw Balance
Professional tool for draws
Configurable Parameters
League List (among all worldwide leagues)
Alert minutes, current score
Goal AVG Media
Live/Prematch Odds
Total live statistics (shots on target, shots off target, attacks, corners, red cards, etc)
Stats range: live statistics per time range or multiple connected ranges (e.g., 2 shots on target from 14th to 23rd minute, etc)
Odds drop on 1x2 market or Asian spreads on the goal line with relative odds
Excel Export
Custom Alerts
Alerts are sent to your personal Telegram channel or displayed exclusively in the dashboard (test mode). The dashboard integrates the Strategy test function, which allows you to extract advanced statistics on the success rate of your alerts with a single click. Alerts can be exported to an Excel sheet with all the main parameters for more in-depth personal analysis.
Asian Odds
Completely revolutionize the viewing and usage mode
Simplified View
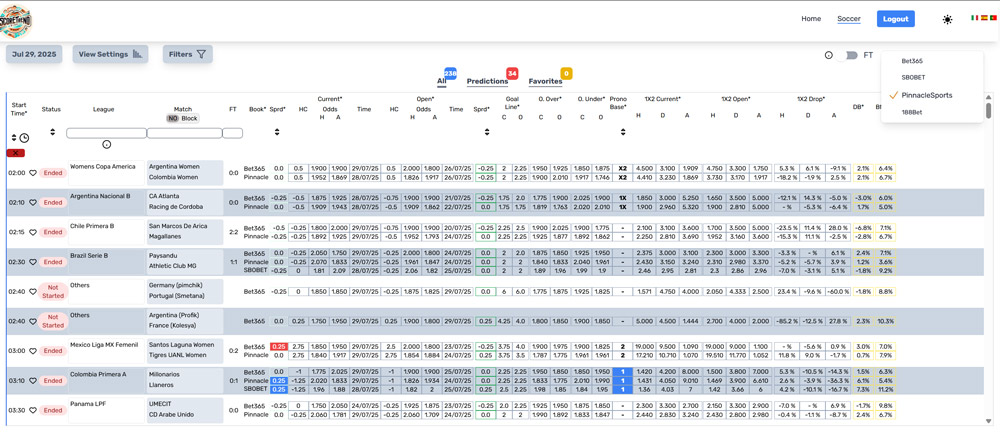
Asianodds are completely free with the exception of the powerful Draw Balance indicator. Exclusive display of the handicap line referring to the favorite with simpler and more immediate reading.
Only +0.75 or -0.75 are present for the same match, making reading simpler, more compact and immediate.
In recent years, Asian bookmakers are "manipulating" closing odds to alter "natural" Asian configurations.
For this reason, the 3 main bookmakers are consecutively included in the basic view. The Asian configuration becomes significant if present on at least 2 bookmakers.
Significant Spreads
The signal of configurations is strong when the spread on handicap and on the goal line shows significant variations. By convention, if the spread is favorable to the team it has a (+) sign, if unfavorable it has a (-) sign. If the handicap changes from +0.50 (start) to +0.75 (current), the spread has been bought by the favorite team: the prediction will be more reliable.
For the odds drop, if the percentage is positive (green arrow down)
it means that the odds between opening and current have decreased; if negative, they have increased.
In the "Pronostici" (Predictions) TAB, the basic predictions made with Asian odds (without statistics and more) are included. The inserted predictions have the color:
Predictions Tab
Sign 1
Home team - Blue Color
Sign 2
Away team - Red Color
Double Chance
With draw - Yellow Color
Live Scanner
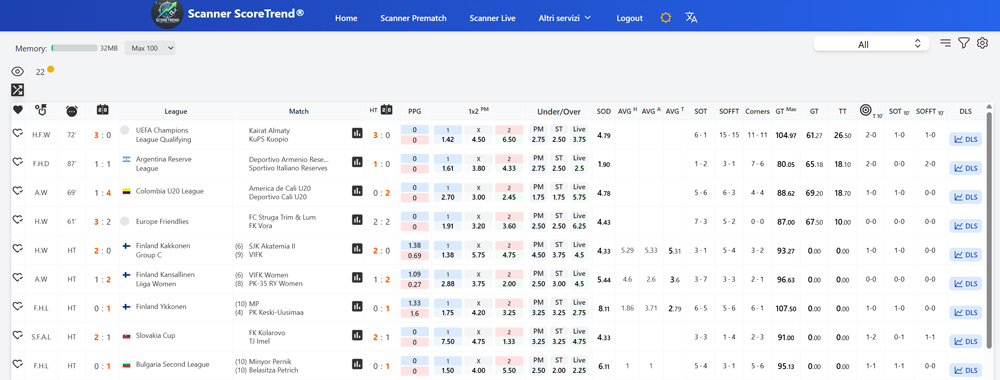
The live scanner is a tool for simultaneous monitoring of all live matches.
The main statistics to be used in live events and our proprietary indicators are integrated into the scanner.
The scanner is highly customizable with powerful filters to select the live matches to monitor.
The scanner has colored visual alarms when certain indicator values or favorite statistics are reached.
Proprietary Indicators
Live Data
Exclusive feature of our scanner are the predefined "strategies" that identify value matches according to the following conditions:
Prematch Scanner
The Prematch Scanner is a unique tool that allows you to filter any pre-match statistic or Asian odds. The scanner is fully customizable by the user and operates in integration with the pre-match Telegram bot.
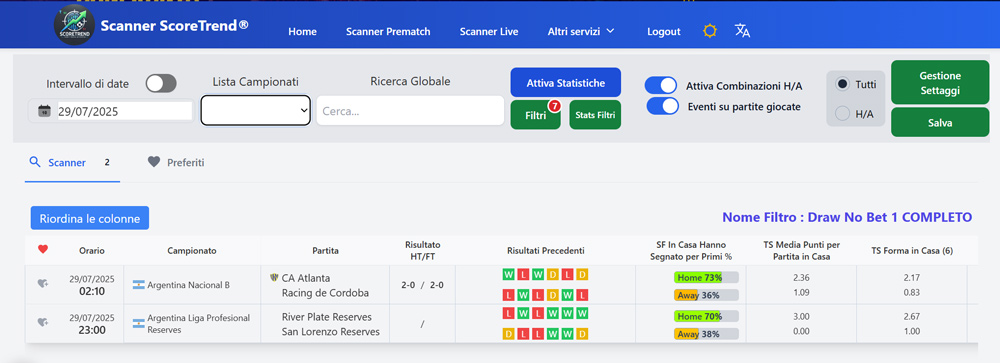
Telegram Bot Integration
The filters tested on the Prematch Scanner can be inserted into a JSON file to obtain automated Telegram alerts without the need to further use the scanner. With one click, you get your historically testable predictions.
Advanced Filters
- • Any prematch and live statistics
- • Choice of day or range of days
- • League list
- • Filters on any condition
Odds and Handicap
- • Pinnacle and main bookmaker odds
- • Asian handicaps and spreads
- • Home/Away statistics
- • Number of events on played matches
Savable Strategies
- • Saving to local computer
- • Integrated remote server
- • Default strategies with high success rate
- • Historical test available
Prematch Alert
Exclusive bot with statistics and Asian odds
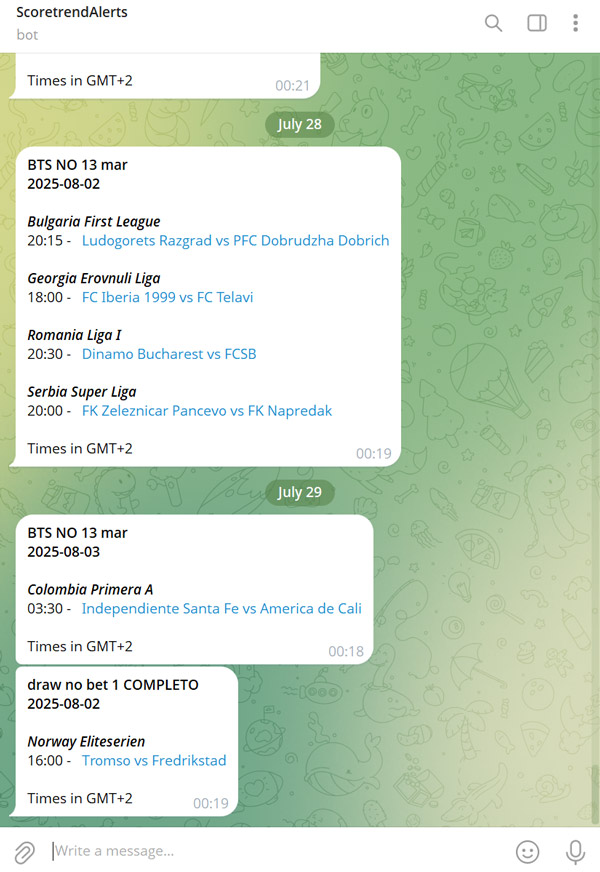
The pre-match Bot is an exclusive of ScoreTrend. No other site or service has a bot with all integrated statistics and Asian odds.
The Prematch Bot has the ability to send two different types of alerts:
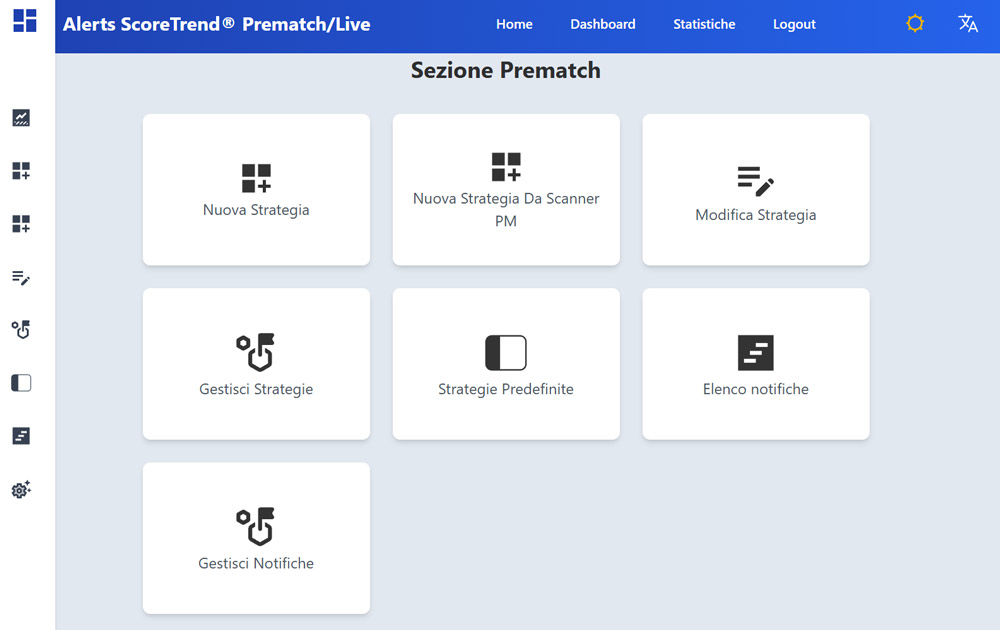
Prematch Trading on Odds
Through the Draw Balance you receive signals for draw betting 2 to 5 days before the match.
Prematch draw trading becomes a "mechanical strategy" accessible to everyone!
Statistics Alert
Test statistical strategies on the prematch scanner and transfer the settings directly to the bot.
Full integration with statistics and Asian odds
Smartphone Applications
ScoreTrend wherever you are
Optimized Version
ScoreTrend expresses its full potential in the web desktop version. The developed tools require adequate screen space to be optimally analyzed.
All ScoreTrend services and tools are available within the mobile applications with an interface optimized for smartphones.
Responsive optimized website version

Ready to Start?
Discover all ScoreTrend tools and start professional sports trading with our proprietary algorithms.
Proprietary Algorithms
Unique non-replicable technology
Real-Time Data
Updates every 30 seconds
Proven Results
Success rate over 80%