The ScoreTrend bar chart displays the dynamics of a match through histogram bars that are updated every 30 seconds. The height of each bar represents the intensity of play minute by minute. The higher the coloured bar (blue or red), the more intense the offensive activity of the corresponding team: attacks, shots, ball possession, corner kicks and other significant actions.
The charts allow our users to monitor any live match with an approximation of reality that is unmatched by any other service on the market.
ScoreTrend is the only platform that provides real-time charts for any football match worldwide.
The aim of ScoreTrend is to enable users to understand the real dynamics of the match and facilitate operational decisions without the need to watch the live television broadcast of the match.
Height of the bars in the graph
The graph shows the trend of the match minute by minute. The height of the bar is directly proportional to the intensity of a team's play. The more a team attacks, shoots on goal, shoots off target, collects corners, etc., the greater the height of the rectangle will be.
The algorithm that calculates the value is proprietary and was developed by Gianluca Landi. The formula takes into account numerous parameters, each of which is assigned its own weighting. If the height of the rectangle is limited, it means that the teams are “static” and the match is not competitive: those who have bet on an under can remain in position until there is an increase in value.
Our graph is unique and cannot be compared or confused with any similar product. For example, Sofascore and other services have unidirectional bars that are conceptually wrong. In one minute, there can be dangerous opportunities for both teams. The most reliable pattern leading to a goal is precisely a bidirectional bar in the same minute.
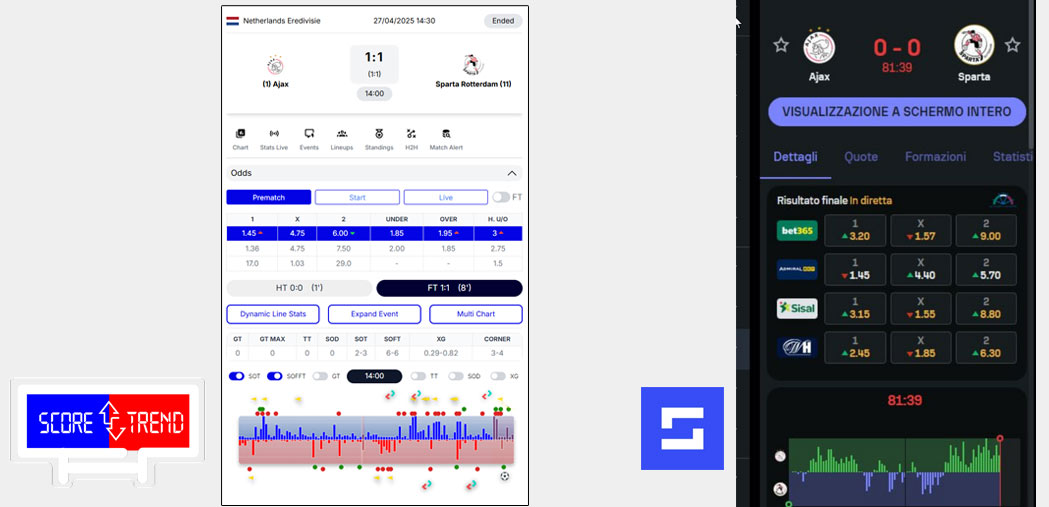
The two graphs show:
- • ScoreTrend the bidirectional bar
- • Sofascore no, only one-way bar
Recurring graphic patterns
It is important to analyse the patterns that form in charts, as they can offer interesting trading opportunities::
- • Tall monochromatic bars for a team --> Indicates high intensity play by a specific team. A goal is more likely to be scored by the team corresponding to the colour of the bars. In some scenarios, a counterattack goal may occur.;
- • Two-way bar (red and blue in the same minute) --> Goal opportunities occurred for both teams in the same minute. This is one of the most significant patterns: goals are generally scored with an extremely high success rate.;
- • High bars in both directions --> The teams are playing on the counterattack, a frequent configuration in the final phase of the second half. The teams are tactically disorganised, fatigued and intensely seeking a goal. Appropriate scenario for entering over markets.;
- • Reduced bars in one or both directions --> Teams show limited intensity, with play concentrated mainly in midfield, far from the penalty areas. Shots are sporadic and not dangerous. This scenario is appropriate for maintaining under markets or scalping operations.
The graph represents a unique tool to support live trading, providing objective indications of the dynamics on the pitch. It is important to consider that a goal can occur at any moment due to individual errors (defender, goalkeeper, etc.).
Chart update
The graph bars are updated every 30 real seconds, and each rectangle closes completely after 1 minute. After 30 seconds, the bar is formed with the data received from the providers, which completes after another 30 seconds, generating the final visualization.
You can monitor the match through the graph with minimal latency compared to real time. It can be said that the matches are "displayed" with less delay than streaming platforms like DAZN, Sky Go, and similar.
ScoreTrend provides graphs of all global matches updated every 30 seconds. We make no distinction between lower leagues and the Top League: for ScoreTrend, football is universal. All teams in ScoreTrend have the same value and operational importance.