Live football statistics present significant inconsistencies even within the same website. This issue represents a fundamental operational challenge for those who work professionally in sports trading. Most websites and applications currently available do not recognize this technical issue and, consequently, lack the expertise needed to manage and resolve it effectively.
Live statistics come from different data providers, each with their own proprietary methodologies for calculating statistical metrics. Within the same league, such as the Premier League, it's possible to find statistics from one match processed by one provider and those from another match processed by a different provider. Therefore, it's not possible to compare metrics with seemingly identical values because the underlying calculation methods differ substantially.
Statistics vary even within the same website, compromising the reliability of comparative analyses.
Differences in Stat Counting
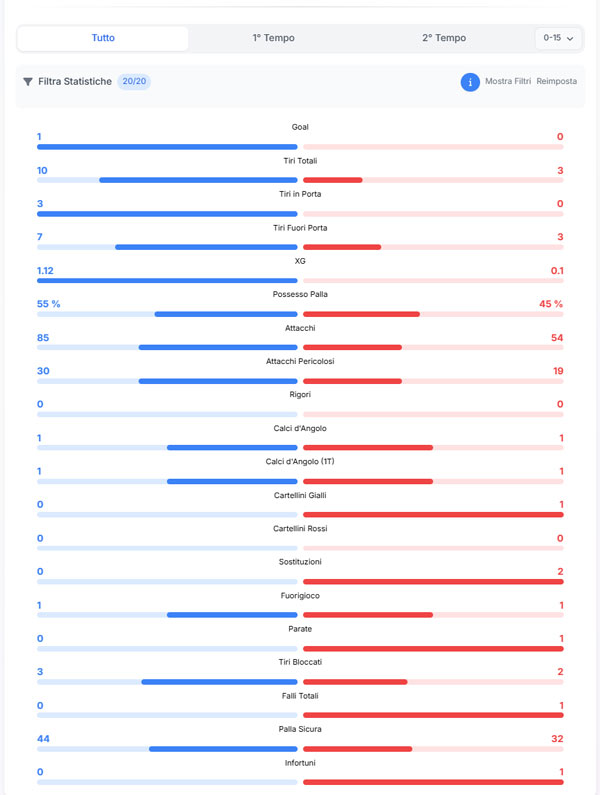
Some live statistics vary significantly between providers due to different calculation methodologies. Shots on target are not a standardized metric that is uniform across all providers: if a shot comes from a specific distance and is not exactly on target, some providers classify it as a valid shot while others do not.
The interpretation of dangerous attacks is the greatest possible. One provider might classify an offensive move that develops from a certain distance from the goalkeeper (e.g., 30 meters) as a dangerous attack, while another provider uses completely different parameters. The scout on the field, who must make split-second decisions, necessarily applies subjective criteria. The value of these statistics varies based on:
- • provider;
- • technology used;
- • individual scout assessment
Statistics that vary depending on the provider
Live statistics that depend on the provider's calculations are:
- • shots on target;
- • shots off target;
- • attacks;
- • dangerous attacks;
- • goalkeeper saves;
- • shots blocked;
- • scoring chances
All these statistics exhibit substantial variations between different providers and even within the methodologies used by the same provider.
The live statistics that remain unchanged across all providers are exclusively those defined in a unique and objective way:
- • goals;
- • corners;
- • yellow cards;
- • red cards;
- • other clearly coded regulatory events
ScoreTrend has developed a proprietary methodology to identify the source provider and standardize live statistics ensuring complete consistency. In future technological developments, the calculation of each statistic will be customized based on the specifications of the provider used.
Applications and websites with Alert Goal
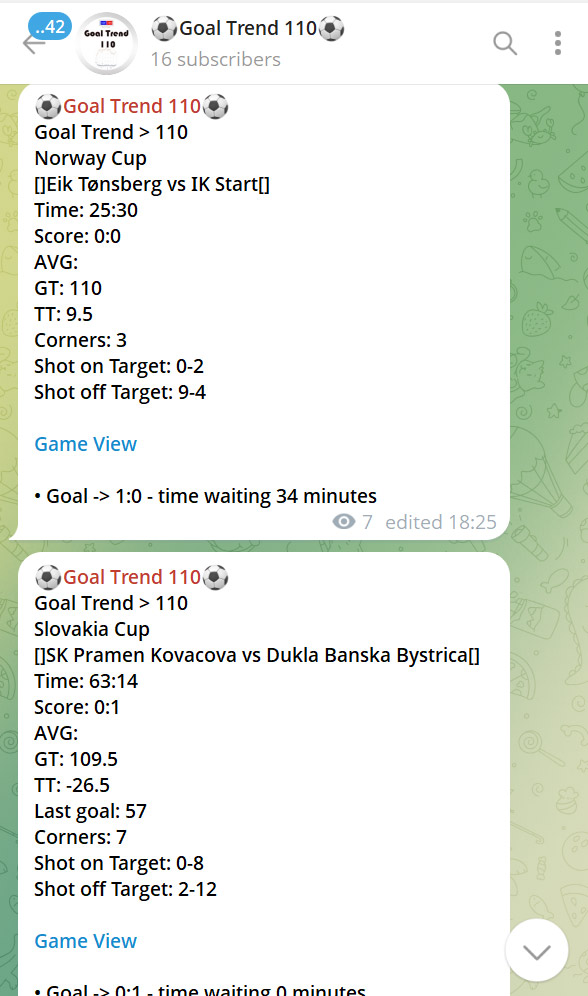
A significant criticality in the sector emerges from observing platforms, applications, and services that develop alert goals using live statistics that "vary" depending on the data provider used.
For each match, these systems cannot identify (lacking the necessary technical expertise) which provider is being used, and consequently, the configured parameters produce unreliable results. It is technically inappropriate to develop alerts or strategies based on fixed parameters (e.g., X shots, X attacks) without considering the inherent calculation variability of providers. This technical issue affects all services and platforms currently available on the market.
The criticality reaches its peak when back-testing systems on historical data to optimize operational configurations. Since it's impossible to retrospectively identify which provider was used for each game, the results are completely random and devoid of any reliable statistical value.
Concrete example of the problem
For Milan-Juventus, Provider 1 recorded 9 total shots on target, while Provider 2 recorded only 7 for the same match. Today, Provider 1 is used for Milan-Juventus, while the following week, Provider 2 is used for Juventus-Inter: the calculation methodology for the shots is completely different, while the parameters that trigger the alerts remain identical. Today, the alerts are triggering correctly; next time, they may not be triggered despite the same actual game intensity.
This inconsistency is exponentially amplified when considering all matches, all championships, and all seasons. This variability is unacceptable for professional operators who require absolute precision, methodological rigor, and obsessive reliability in statistical analyses.
ScoreTrend's Homogeneous Graphs
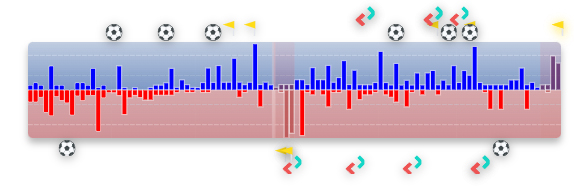
ScoreTrend graphs are completely homogeneous and allow you to compare matches from different leagues with full statistical and methodological reliability. The bar graphs are generated using an advanced proprietary algorithm that assigns specific and calibrated weights to the different statistics and providers. This technological methodology results in perfectly homogeneous match graphs and, consequently, completely comparable with each other.
The Goal Trend graph represents a homogeneous visualization with numerical values directly comparable between matches in different leagues. It is possible to compare the bars of the Milan-Inter graph with those of Barcelona-Real Madrid: the algorithmic calculation basis is identical and standardized. GT values can be used in alerts, ensuring uniform and reliable parameters for all teams and leagues worldwide.
ScoreTrend's live statistics come from different providers as previously explained: the fundamental difference and competitive advantage lies in the proprietary data processing to ensure completely homogeneous and comparable graphs.
Professional users are advised to use the Goal Trend as the primary basis of their trades and to consider other statistics as secondary support and confirmation parameters.
This standardization represents a unique competitive advantage that positions ScoreTrend as the only technological solution on the market capable of providing statistically reliable comparative analysis for professional sports trading.